 Skip to content
MAT 240 Module 2 Assignment Selling Price and Area Analysis

Student Name
Course Name
Southern New Hampshire University
Prof. Name
Submission Date
- MAT 240 Module 2 Assignment Selling Price and Area Analysis for D.M. Pan National Real Estate Company
Introduction
The purpose of this report is to provide an analysis that will show the relationship between the selling price of properties and their size in square feet, so that, as a Real Estate Company, we can provide our clients with the best advice to make the best decisions as new homeowners or home sellers.
The West South-Central region is the region that I have selected. I’ve chosen my sample of 30 by using Excel’s Rand function and choosing the first 30 randomly. The descriptive analysis for the listing price and square foot variables is as follows:
Mean: $296,713 Median: $272,850 Standard Deviation: $94,911
Square Foot
Mean: 2,222 Median: 2,015 Standard Deviation: 725
Data Analysis
The sample’s listing prices are about $45,000 lower than the national market, and have slightly more square footage than the national market. The price per square foot of the sample is also less than the national market. I made sure that the sample is random using Excel’s Rand function. This causes the data to be sorted randomly, and when sorted, I can take 30 random samples from the selected region.
Scatterplot
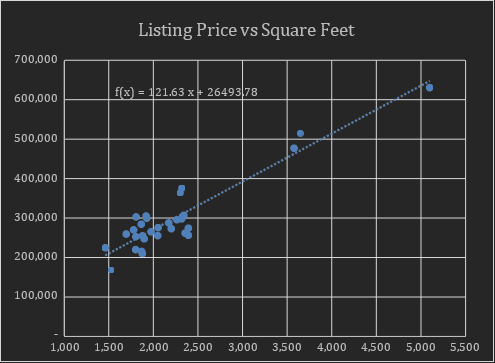
The Pattern
The x-variable is useful for predicting because the amount of square footage that determines the listing price.
The association between x and y in the scatterplot is that as the square feet increase, the listing price increases. The scatter plot shows a linear shape. I would note one outlier, which is at the high end of the trend line, with a listing price of $630,800 and 5,107 square feet. This may be a result of the random sampling from this area. The other reason may be that a handful of homes in this area will be listed for much more than the homes in this area because these homes are a lot larger.
The house would cost $245,428 according to the regression equation in the graph, because it appears as if this is the going rate for this region based on this equation.
