
MATH 1300 Week 2 Assignment: Homework 2 Solutions

Homework 2
Student Name
William Penn University
MATH1300
Professor Name
Submission Date
Practice Problem for Module 2
A random sample of 50 students’ GPAs reveals that the mean GPA is 2.8 with a standard deviation of 0.45.
Construct a 95% Confidence Interval for the mean GPA of the population:
Sample mean (x̄) = 2.8
Sample standard deviation (s) = 0.45
Confidence level = 95%
Here’s what we need to do:
Since we don’t know the population standard deviation and the sample size is greater than 30, we can use the z-distribution. For a 95% confidence level, the critical value (z) is 1.96.
Calculate the margin of error:
Margin of error (E) represents the amount we need to add and subtract from the sample mean to create the confidence interval. We can calculate it using the formula:

where:
z is the critical value (1.96)
s is the sample standard deviation (0.45)
n is the sample size (50)
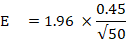
= 0.13
Construct the confidence interval:
We can find them using the following formulas:
Lower bound: x̄ – E = 2.8 – 0.13 = 2.67
Upper bound: x̄ + E = 2.8 + 0.13 = 2.93
Therefore, with a 95% confidence level, we can estimate that the true population mean GPA falls between 2.67 and 2.93.
Interpretation: We can be 95% confident that the average GPA of the entire population from which this sample was drawn lies somewhere within the range of 2.67 and 2.93.
- If we want to be 90% confident, and we want to control the maximum error of estimation to be 0.2, how many more students should be added into the given sample?

To calculate the required sample size for a 90% confidence level with a maximum error of estimation of 0.2, we’ll use the formula for the margin of error (ME):
To find the number of students we will reverse this formula and will get


Therefore, we need to add 14 more students to the given sample to achieve a 90% confidence level with a maximum error of estimation of 0.2.
- Would you conclude that the mean GPA more than 2.5 at 5% level of significance?
To test whether the mean GPA is more than 2.5 at a 5% level of significance, we can conduct a one-sample t-test.
Null Hypothesis (H0): Mean GPA = 2.5
Alternative Hypothesis (H1): Mean GPA > 2.5
We’ll set the significance level to 0.05.
If the calculated p-value is less than 0.05, we reject the null hypothesis and conclude that there is sufficient evidence to suggest that the mean GPA is more than 2.5.
We can use the formula for the t-test:
x̄-µ / (
)
Where:
ˉxˉ is the sample mean GPA (given as 2.8).
μ is the hypothesized population mean GPA (2.5 in this case).
s is the sample standard deviation (given as 0.45).
n is the sample size (given as 50).
Substitute the given values, we get
t =4.716
Now, we need to find the p-value associated with this t-value using a t-distribution table
With level of significance df = n−1
= 50-1
With df=n−1=49, the p-value corresponding to t≈4.716 is significantly less than 0.05 (it’s practically zero).
the p-value corresponding to ≈4.716 is significantly less than 0.05 (it’s practically zero).
Therefore, we reject the null hypothesis.
Conclusion: At the 5% level of significance, we have sufficient evidence to conclude that the mean GPA is more than 2.5.